
Comparing Tournament Strength Calculations
Computing my disc golf power rankings is not a super complicated task, but it does have a few steps. I take a player’s placement in a particular tournament and give it a point value. I then adjust that value based on the tournament tier (major, national tour, ‘A’, ‘A/B’ etc. Excludes everything ‘B’ and below). I then alter the value based on how old the tournament is (a tournament loses 4% of it’s value every week after). And finally (not really chronologically), I alter the value based on the strength of the field at the tournament. Then I add that number to a list of that player’s results from other tournaments. For each player I sum their top 10 results. I do that for like 2200 players, sort them up and voila!1
Anyway, there is always tweaking to be done. Actually going through such a big tweak not that I haven’t posted my power rankings in a couple weeks.2 The tweak I’m considering now is to the how I determine the strength of a tournament.
Previously I used a pretty simple algorithm: I assembled a list of the top 20 players in a division (MPO, men’s open, or FPO, women’s open), based on earnings since the beginning of my data, which we’ll call Day 0.3 I would then, for a particular tournament, count how many of those top players competed. If 15 of more were there, I considered the tournament as a top level tournament in terms of strength, and the players point value would receive no strength penalty. If there were 10-14 of the top money earners there, the tournament lost 10% of it’s value. Then for every top player it lacked below 10, the tournament would take a further 10% hit. So something like…
| Top 20 Money Winners Participating | Tournament Strength Penalty Factor |
| 15-20 | 1 |
| 10-14 | .9 |
| 9 | .81 |
| 8 | .729 |
| 7 | .6561 |
| 6 | .59049 |
| 5 | .531441 |
| 4 | .4782969 |
| 3 | .43046721 |
| 2 | .387420489 |
| 1 | .3486784401 |
| 0 | .31381059609 |
It seemed to work alright. It gave me these lists as the tournaments with the strongest fields (tournaments without a year are 2021)…
| Rank for MPO | Tournament Name | MPO Strength Penalty | Rank for FPO | Tournament Name | FPO Strength Penalty |
| 1 | Dynamic Discs Open | 1 | 1 | Dynamic Discs Open | 1 |
| 1 | Las Vegas Classic | 1 | 1 | Las Vegas Classic | 1 |
| 1 | Waco Charity Open | 1 | 1 | Waco Charity Open | 1 |
| 1 | Portland Open | 1 | 1 | Portland Open | 1 |
| 1 | Texas States | 1 | 1 | Texas States | 1 |
| 1 | OTB Open | 1 | 1 | Santa Cruz Masters | 1 |
| 1 | Jonesboro Open | 1 | 7 | OTB Open | .9 |
| 8 | Memorial Open | .9 | 7 | Jonesboro Open | .9 |
| 8 | The Open at Belton | .9 | 7 | The Open at Belton | .9 |
| 8 | Santa Cruz Masters | .9 | 7 | US Womens Championship | .9 |
| 8 | Vintage Open | .9 | 11 | Utah Open | .81 |
| 8 | Mid-American Open | .9 | 12 | Vintage Open | .6561 |
| 13 | Utah Open | 0.729 | 13 | Memorial Open | 0.59049 |
| 14 | Goat Hill Park | 0.59049 | 13 | Goat Hill Park | 0.59049 |
| 15 | Shelly Sharpe Memorial | 0.430467 | 15 | Victoria Open | 0.430467 |
| 15 | The 303 Open | 0.430467 | 15 | Mid-American Open | 0.430467 |
| 15 | The Open at Belton 2020 | 0.430467 | 17 | Tennessee States | .387420489 |
| 18 | Huk Central | .387420489 | 17 | Bowling Green Open | .387420489 |
| 18 | Chain Hawk Open | .387420489 | 17 | St. Patricks Classic | .387420489 |
| 18 | Bowling Green Open | .387420489 | 17 | Norman Pro-Am | .387420489 |
| 17 | The Open at Belton 2020 | .387420489 |
So I have assigned a penalty to tournaments with fewer top players. Here’s what the power rankings look like using this criterium to measure tourney strength…

But of course not all top-20 moneyed players are the same. If I had to play for my life against either the Mandujano sisters or Paige Pierce/Cat Allen, I’m getting full on whooped, and Alexis and Valerie are great young players, but… Cat and Paige are world champs. So what if I include how highly ranked players are in the top 20…
So I made the tweak. I took the list of the top 20 money winners, and instead of considering them equally, I gave them points from 20-1 inversely to their ranking (1st got 20, 2nd got 19, etc.). Then I totalled the points for those who participated in each tournament. Any tournament that scored equal to or over 150, got credit for being a fully stacked tournament. If they scored less, their penalty factor was .9 raised to the power of 150 minus their score ,divided by 10.4
So what did we come out with after that madness? Here’s the new tournament strength table:
| MPO Rank | Tournament | MPO St. Penalty | Penalty Change | FPO Rank | Tournament | FPO St. Penalty | Penalty Change |
| 1 | Dynamic Discs Open | 1 | 1 | Dynamic Discs Open | 1 | ||
| 1 | Las Vegas Classic | 1 | 1 | Las Vegas Classic | 1 | ||
| 1 | Waco Charity Open | 1 | 1 | Waco Charity Open | 1 | ||
| 1 | Portland Open | 1 | 1 | Portland Open | 1 | ||
| 1 | Santa Cruz Masters | 1 | +.1 | 1 | Santa Cruz Masters | 1 | |
| 1 | Texas States | 1 | 1 | Texas States | 1 | ||
| 1 | OTB Open | 1 | 1 | Jonesboro Open | 1 | +.1 | |
| 1 | Jonesboro Open | 1 | 1 | US Womens | 1 | +.1 | |
| 9 | The Open at Belton | 0.958732 | +.058732 | 9 | The Open at Belton | 0.890567 | -.009433 |
| 10 | Vintage Open | 0.853815 | -.046185 | 10 | OTB Open | 0.836012 | -.063988 |
| 11 | Mid-American Open | 0.609452 | -.290548 | 11 | Utah Open | 0.603065 | -.206935 |
| 12 | Memorial Open | 0.584301 | -.315699 | 12 | Vintage Open | 0.525871 | -.130229 |
| 13 | Utah Open | 0.430467 | -.298533 | 13 | Memorial Open | 0.458558 | -.131932 |
| 14 | Goat Hill Park | 0.371432 | -.219058 | 14 | Goat Hill Park | 0.421491 | -.168999 |
| 15 | Shelly Sharpe Memorial | 0.294587 | -.13588 | 15 | Victoria Open | 0.291499 | -.138968 |
| 15 | The 303 Open | 0.294587 | -.13588 | 16 | The Open at Belton 2020 | 0.288444 | -.098976 |
| 17 | Huk Central | 0.291499 | -.092833 | 17 | Mid-American Open | 0.279469 | -.150998 |
| 18 | Chain Hawk Open | 0.246278 | -.141142 | 18 | St. Patricks Classic | 0.265128 | -.122292 |
| 19 | The Open at Belton 2020 | 0.243697 | -.18677 | 19 | Norman Pro-Am | 0.256879 | -.130541 |
| 20 | Tennessee States | 0.238615 | NA | 20 | Shelly Sharpe Memorial | 0.246278 | NA |
So, wow. Big changes. Similar stories in MPO and FPO. The top tier tournaments stayed at the top and were joined by a couple tourneys that couldn’t quite hit 15 from the top 20 list, but the players who went were bosses. Then there were a couple of second tier tourneys that didn’t move far from their previous scores. Then after the top 10 in each… massive cliff. Mid-tier tourneys lost a lot of strength value. This creates a situation in which results from the top 10 tournaments will have a massive effect on the power rankings. I’m expecting some big movement. I should wait until tomorrow morning to run this, but I can’t wait. Here are the power rankings after the change in strength algorithm…
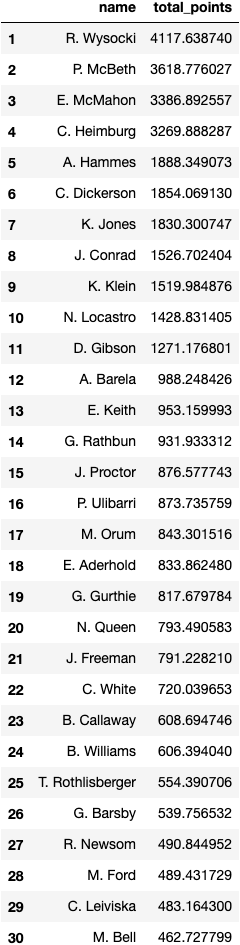
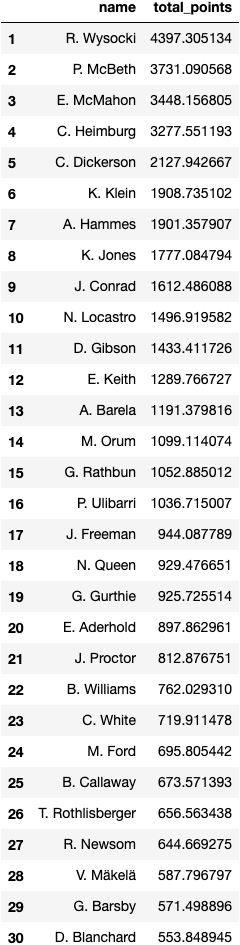
The changes look… very mild. Let’s take a look at the new and old MPO power rankings. The new one will be on the left)…
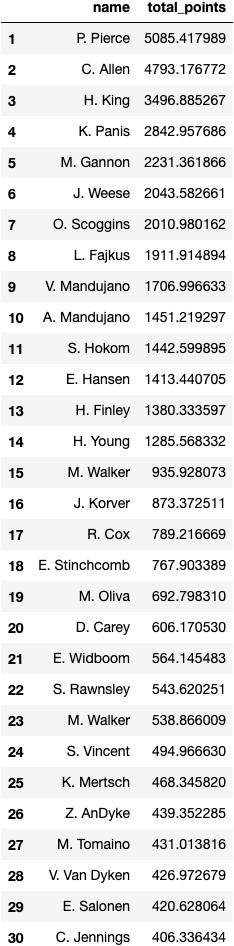
And the new and old FPO rankings, again, the new one will be on the left…
On the MPO side, top four stayed put. Klein dropped a few slots as his wins at Mid-America and 303 lost value. Meanwhile Adam’ Hammes’ win in Santa Cruz and fifths at Jonesboro and Vintage appreciated pushing him up a couple slots. Other than those guys the rest of the top 11 stayed put. In FPO, Ohn dropped a couple places as her wins at Memorial and St. Patricks and the second at Goat Hill took strength hits. Other than her, the top 11 stayed the same.
There are a few more stories down the list and in the score differentials, but I found it interesting how little the rankings changed. I’m excited to see what worlds does to the rankings…
1 Of course, I don’t the calculations by hand. I let the pythons and the pandas, and a few squirrels, handle that for me. If you want to see the code I use, you can check out my relatively sparse github.
2 You can read about that tweak here.
3 Day 0 is currently November 21, 2020. I am continually adding data both forwards and backwards in time.
4 .9**((150-x)/10)