")
My SQL for Data Science Capstone Project: Country Data and Olympic Success (Part 3)
So, when we left off we were looking at population, GDP per capita, and urbanization metrics. Nothing jumped out except the urbanization…
(tl;dr the first five posts in this series… I’m looking at connections between population and economic metrics and country success at the olympics. To start at the beginning, check out part 1.)
(Standard warning in all my posts. I’m a beginner. Nothing below should be taken as the best way of doing things, a good way of doing things, or even a right way of doing things. If you think you know better than me, you probably do. Please comment with better practices)
Ok. I’ll get back to the cool connection between being “pretty urban” and olympically successful, because that’s cool. I wanna jump in to a couple other metrics first to see what we see.
So, generally, the countries with bigger populations were more successful in the olympics. What if we try to factor that out. What about medals per capita as a metric of success? Interesting stuff…
Golds_per_cap*1000000	Country
0	69.631289	Norway
1	52.428762	Liechtenstein
2	47.377741	Sweden
3	44.739101	Hungary
4	35.725647	Finland
...	...	...
84	0.037755	Cote d'Ivoire
85	0.034217	Nepal
86	0.031848	Mozambique
87	0.030257	Peru
88	0.010257	Vietnam
Medals_per_cap*1000000	Country
0	235.929431	Liechtenstein
1	190.288682	Norway
2	162.389302	Finland
3	151.925282	Sweden
4	117.543703	Hungary
...	...	...
84	0.113067	Ecuador
85	0.097842	Jordan
86	0.063697	Mozambique
87	0.041030	Vietnam
88	0.034217	Nepal
Liechtenstein and Scandinavia looking strong.
I need to know a few more fun facts… who sends the most athletes per capita of population?
Some of our old friends…
	Country	Athletes_per_cap*1000000
0	Liechtenstein	9673.106666
1	Luxembourg	1586.735149
2	Finland	         986.424796
3	Norway	        913.680412
4	Sweden	         824.807895
...	...	...
84	Pakistan	2.535955
85	Mozambique	2.484170
86	Vietnam	         1.579649
87	Indonesia	1.485284
88	India	          1.018559
Finally, who is most successful per athlete sent to the olympics? By percentage shot at a medal…
Country	               gold_per_athlete	medals_per_athlete
0	United States	13	29
1	Russia	        13	33
2	India	        9	13
3	Germany	        8	23
4	Pakistan	7	21
...	...	...	...
84	Slovenia	0	4
85	Latvia	        0	3
86	Bahrain	        0	2
87	Luxembourg	0	0
88	Liechtenstein	0	2
Ah, our friend Liechenstein’s athletes are rather unsuccessful, that’s what you get for sending 1% of your population to participate. So who all is at the top?
Country	                gold_per_athlete	medals_per_athlete
0	United States	              13	29
1	Russia	                      13	33
2	India	                       9	13
3	Germany	                       8	23
4	Pakistan	               7	21
5	Norway	                       7	20
6	China	                       6	19
7	Cameroon	               6	7
8	Cuba	                       6	16
9	Hungary	                       6	17
10	Croatia	                       6	17
11	Ethiopia	               5	14
12	United Kingdom	               5	16
13	Italy	                       5	15
14	Zimbabwe	               5	7
15	Sweden	                       5	18
16	Denmark	                       5	16
17	Uruguay	                       5	10
18	Fiji	                       5	5
19	Kenya	                       4	13
Ok. Let’s get back to “The Joys of Semi-Urbanism”…
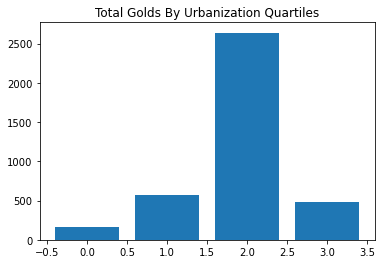
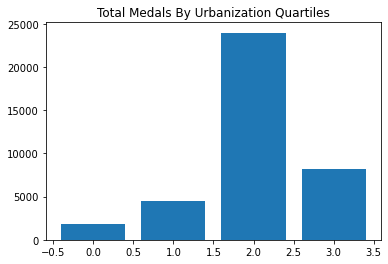
By these bar graphs, the second tier of urbanization is drastically more successful than other countries. What if we change our definition of success though? Let’s look at the quartile breakdown of medals per capita…

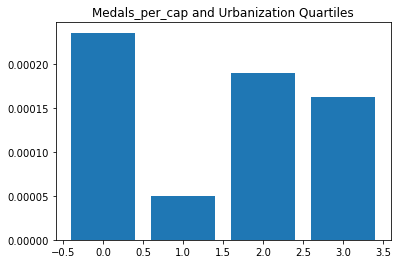
The story has become a lot less drastic. It’s hard to tell a story about the olympic success of semi-urbanized and non-urbanized countries.
Let’s try our new metric for success with a different country metric… GDP per capita it is…
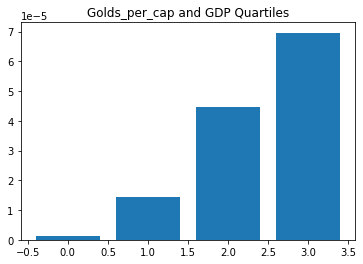
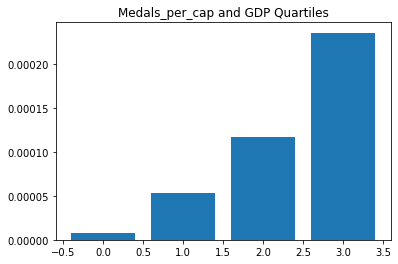
Oh, this looks promising…
(Many months later…)
So after letting this project sit for a while, I decided to go ahead and turn something in and move on in my life. This was a fun experiment. I didn’t really answer any questions, but I learned a lot about pandas, matplotlib, Jupyter Notebooks, and getting distracted.
To close out this project, I leave you with this lovely scatter plot, that should tell you everything you need to know about everything…
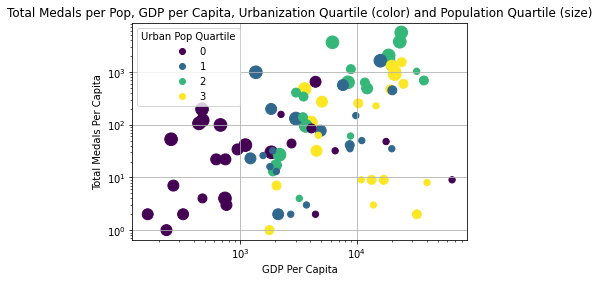
Catch ya next time…